The trades page is one of the most important pages. It will allow you to have an eye on your last positions, on the basic trading indicators and on the direction your profits are going (up or down). It's a good summary of your latest trading results.
Most of the features explained below can be found on other pages in FixyTrade. By taking the time to read this article, it will be easier for you to understand how to use FixyTrade in general.
This page contains 4 important parts:
1 - The time selector
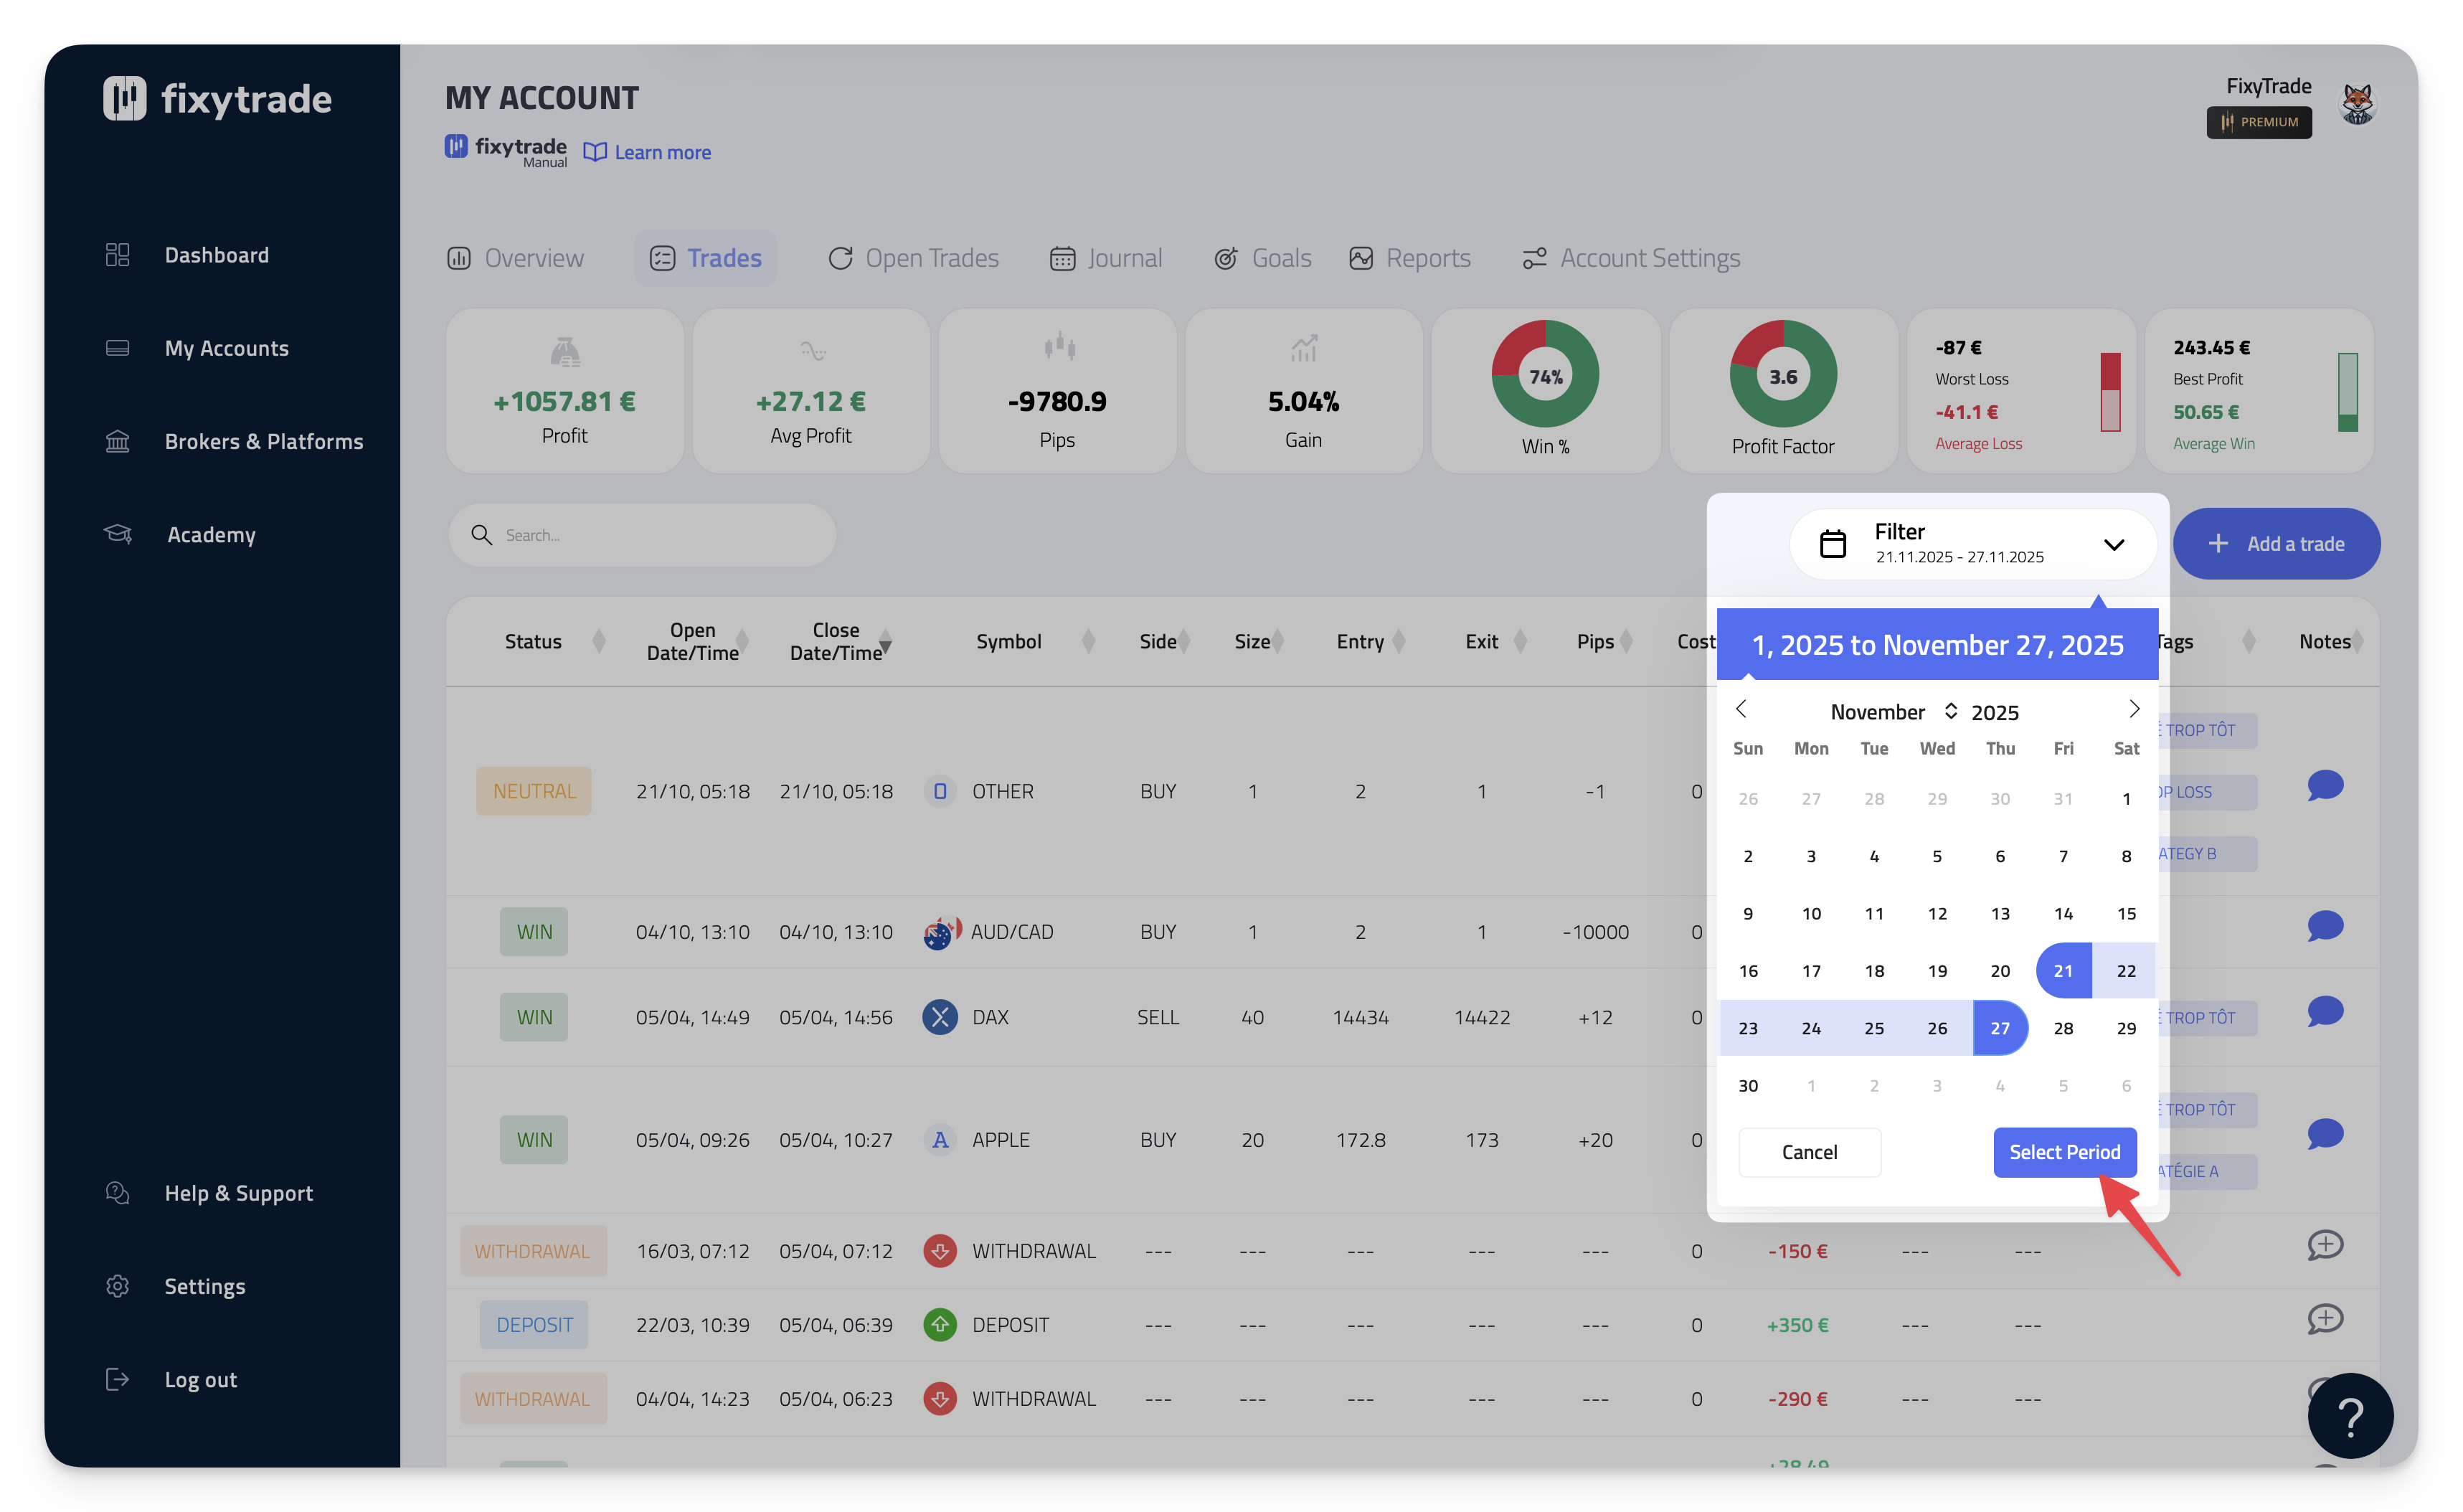
The time selector allows you to filter the trading information to a specific time period. Select a start and end date, then click “Select Period”.
2 - Key indicators in trading
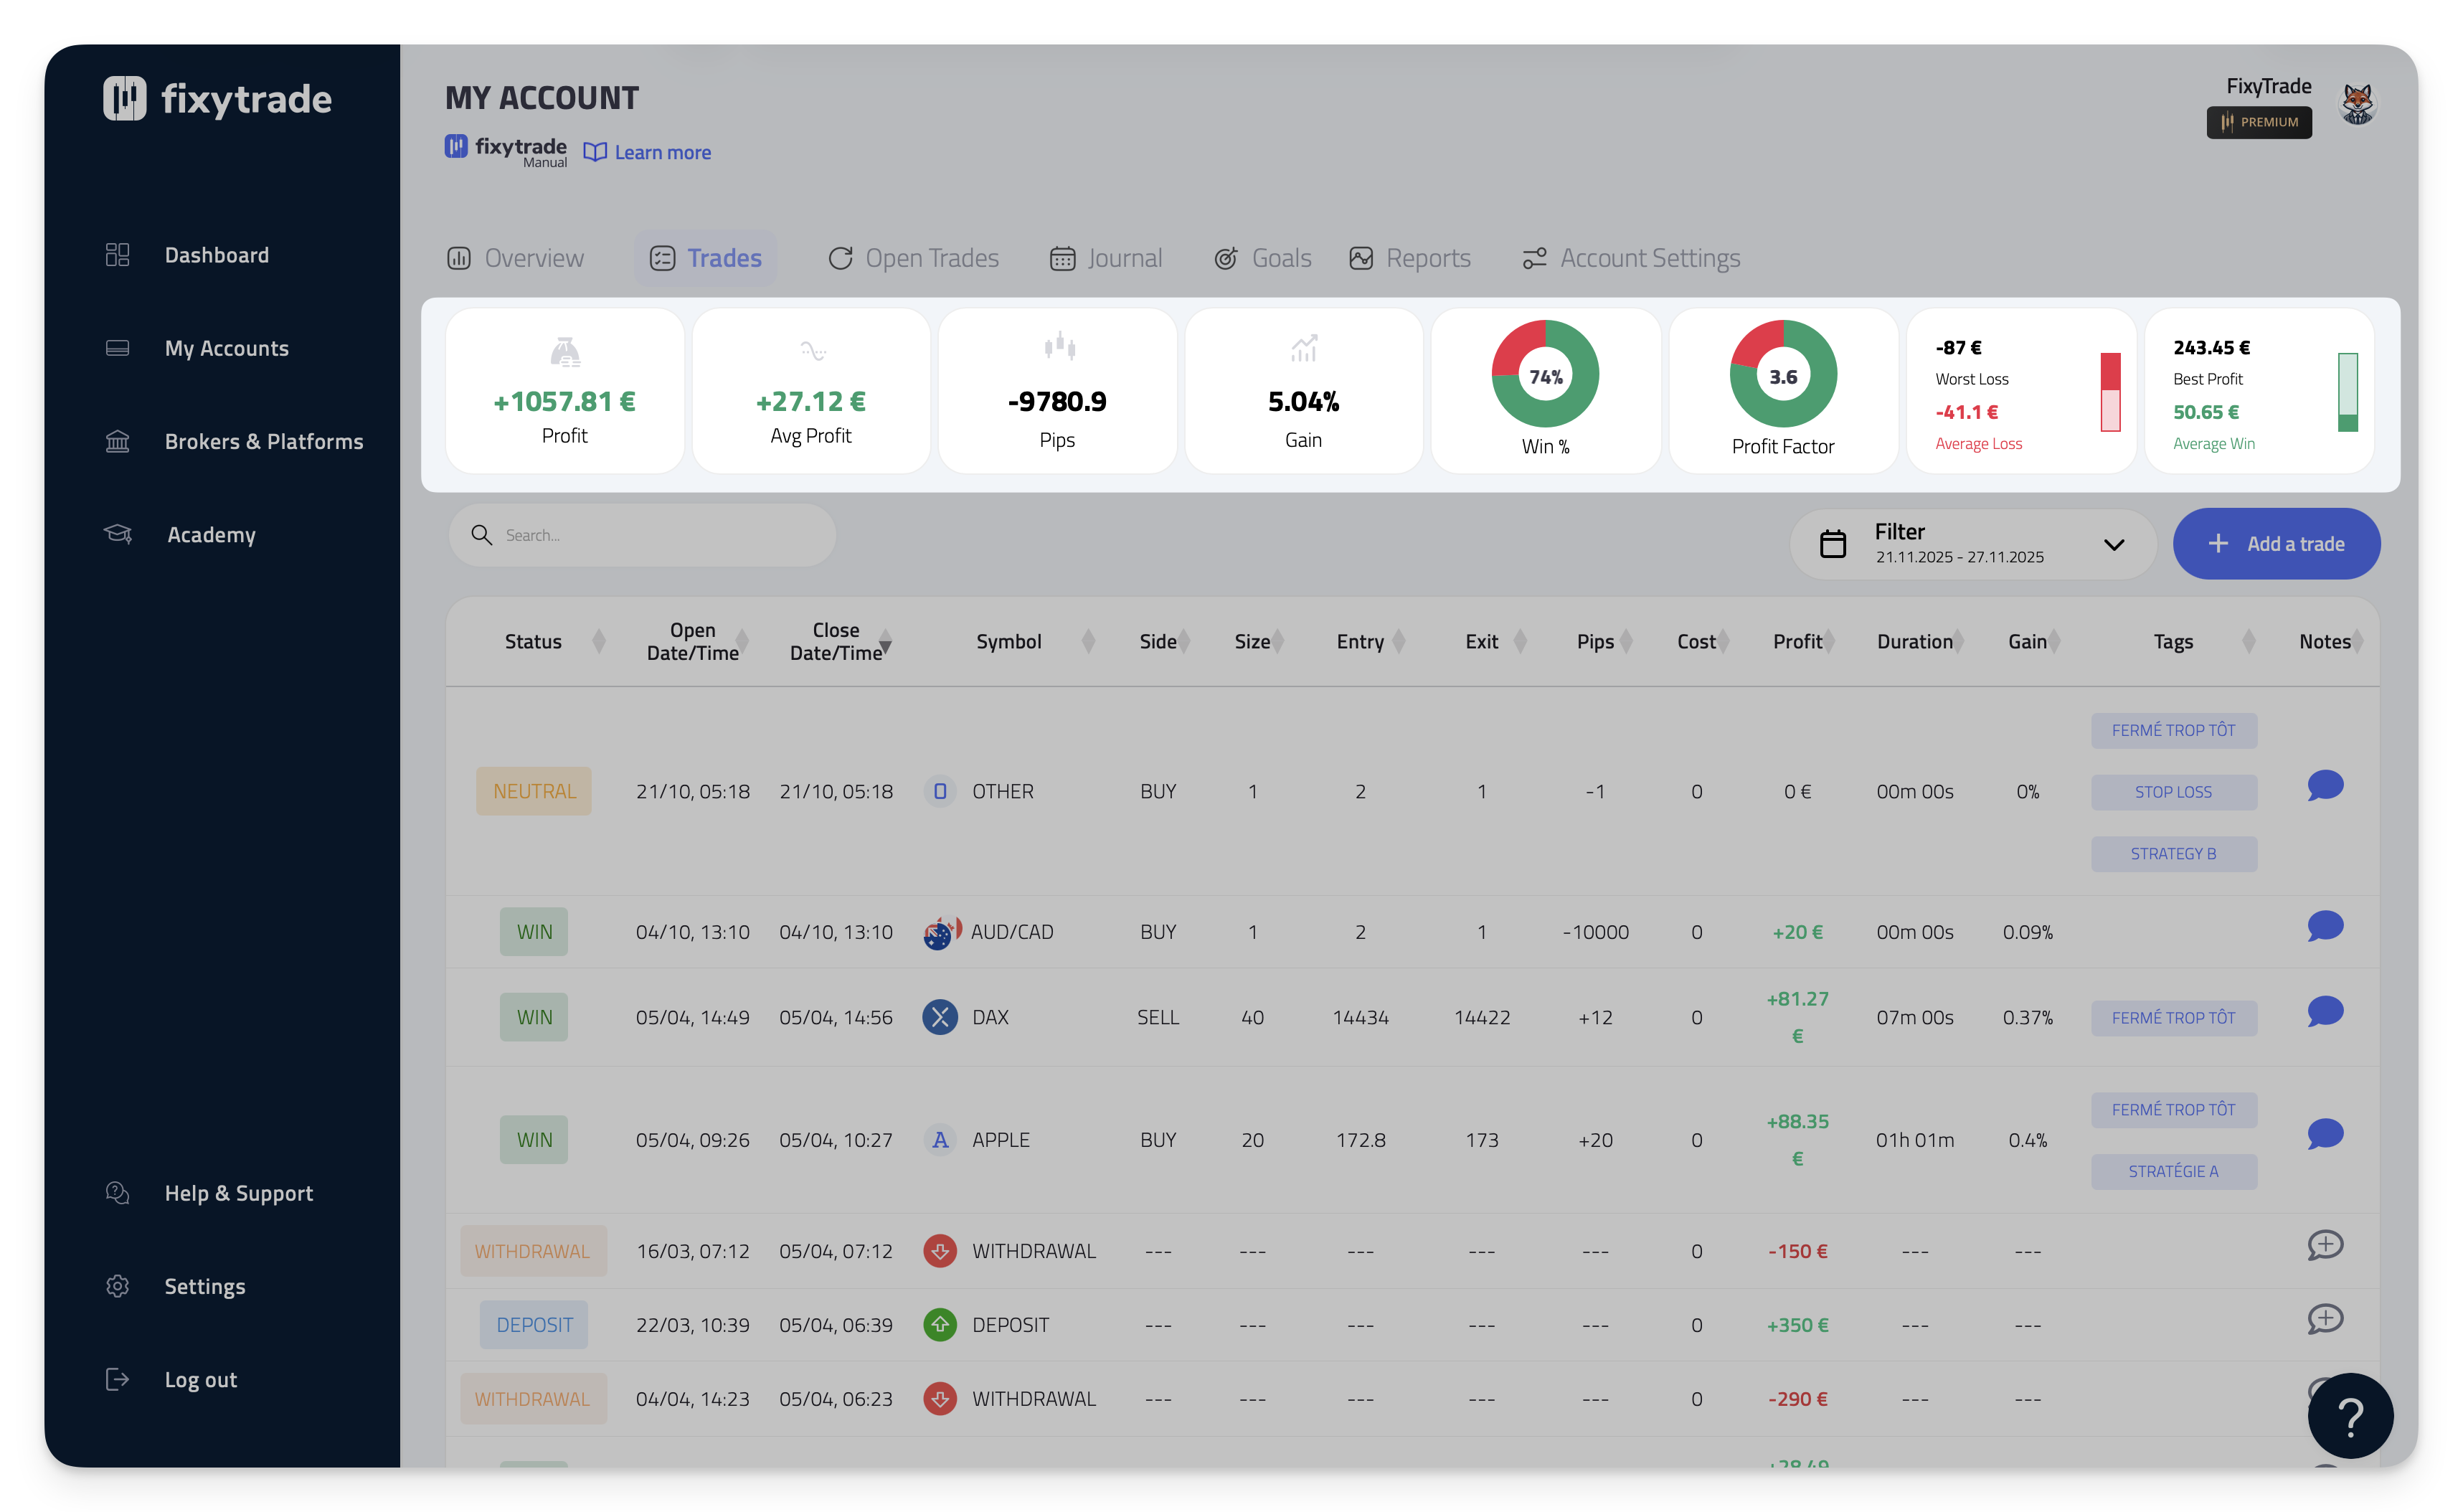
These 10 indicators are an indispensable part of the profitable trader's tools. You will find the main account information, updated in real time according to the time selection made:
-
Profit: Profit is the sum of your net winning minus your net losing from all of your trades. Read more
-
Average profit: Shows the average profit over a total number of trades. Read more
-
Pips: Pip stands for "Percentage In Point" or "Price Interest Point". Pips are used to represent the smallest possible changes in the exchange rate of a currency. Read More
-
Gain: Gain refers to a general increase or decrease of the account value. Read more
-
Win %: The Win is the percentage of your net winning trades divided by the total trades (sum of your winning and losing trades) and then multiplied by 100. It shows the winning percentage from your total trades. Read More
-
Profit Factor: The Profit Factor is the sum of your net winning trades divided by the sum of your net losing trades. It is used to determine if you have good risk management. A profit factor of 1 means you are breaking even. A profit factor of 2 means that for every $1 you risk, you gain $2. If you lose all your trades for the day or have no losses at all, your profit factor will be 0. Read more
-
Worst Loss: Displays the largest loss made on a single trade. Read more
-
Average Loss: The average loss is an indicator of how much money you lose on average for each trade. Read more
-
Best Win: Displays the biggest win made on a single trade. Read more
-
Average Win: Average Win is an indicator of how much money you make on average for each trade. Read more
3 - List of your closed trades
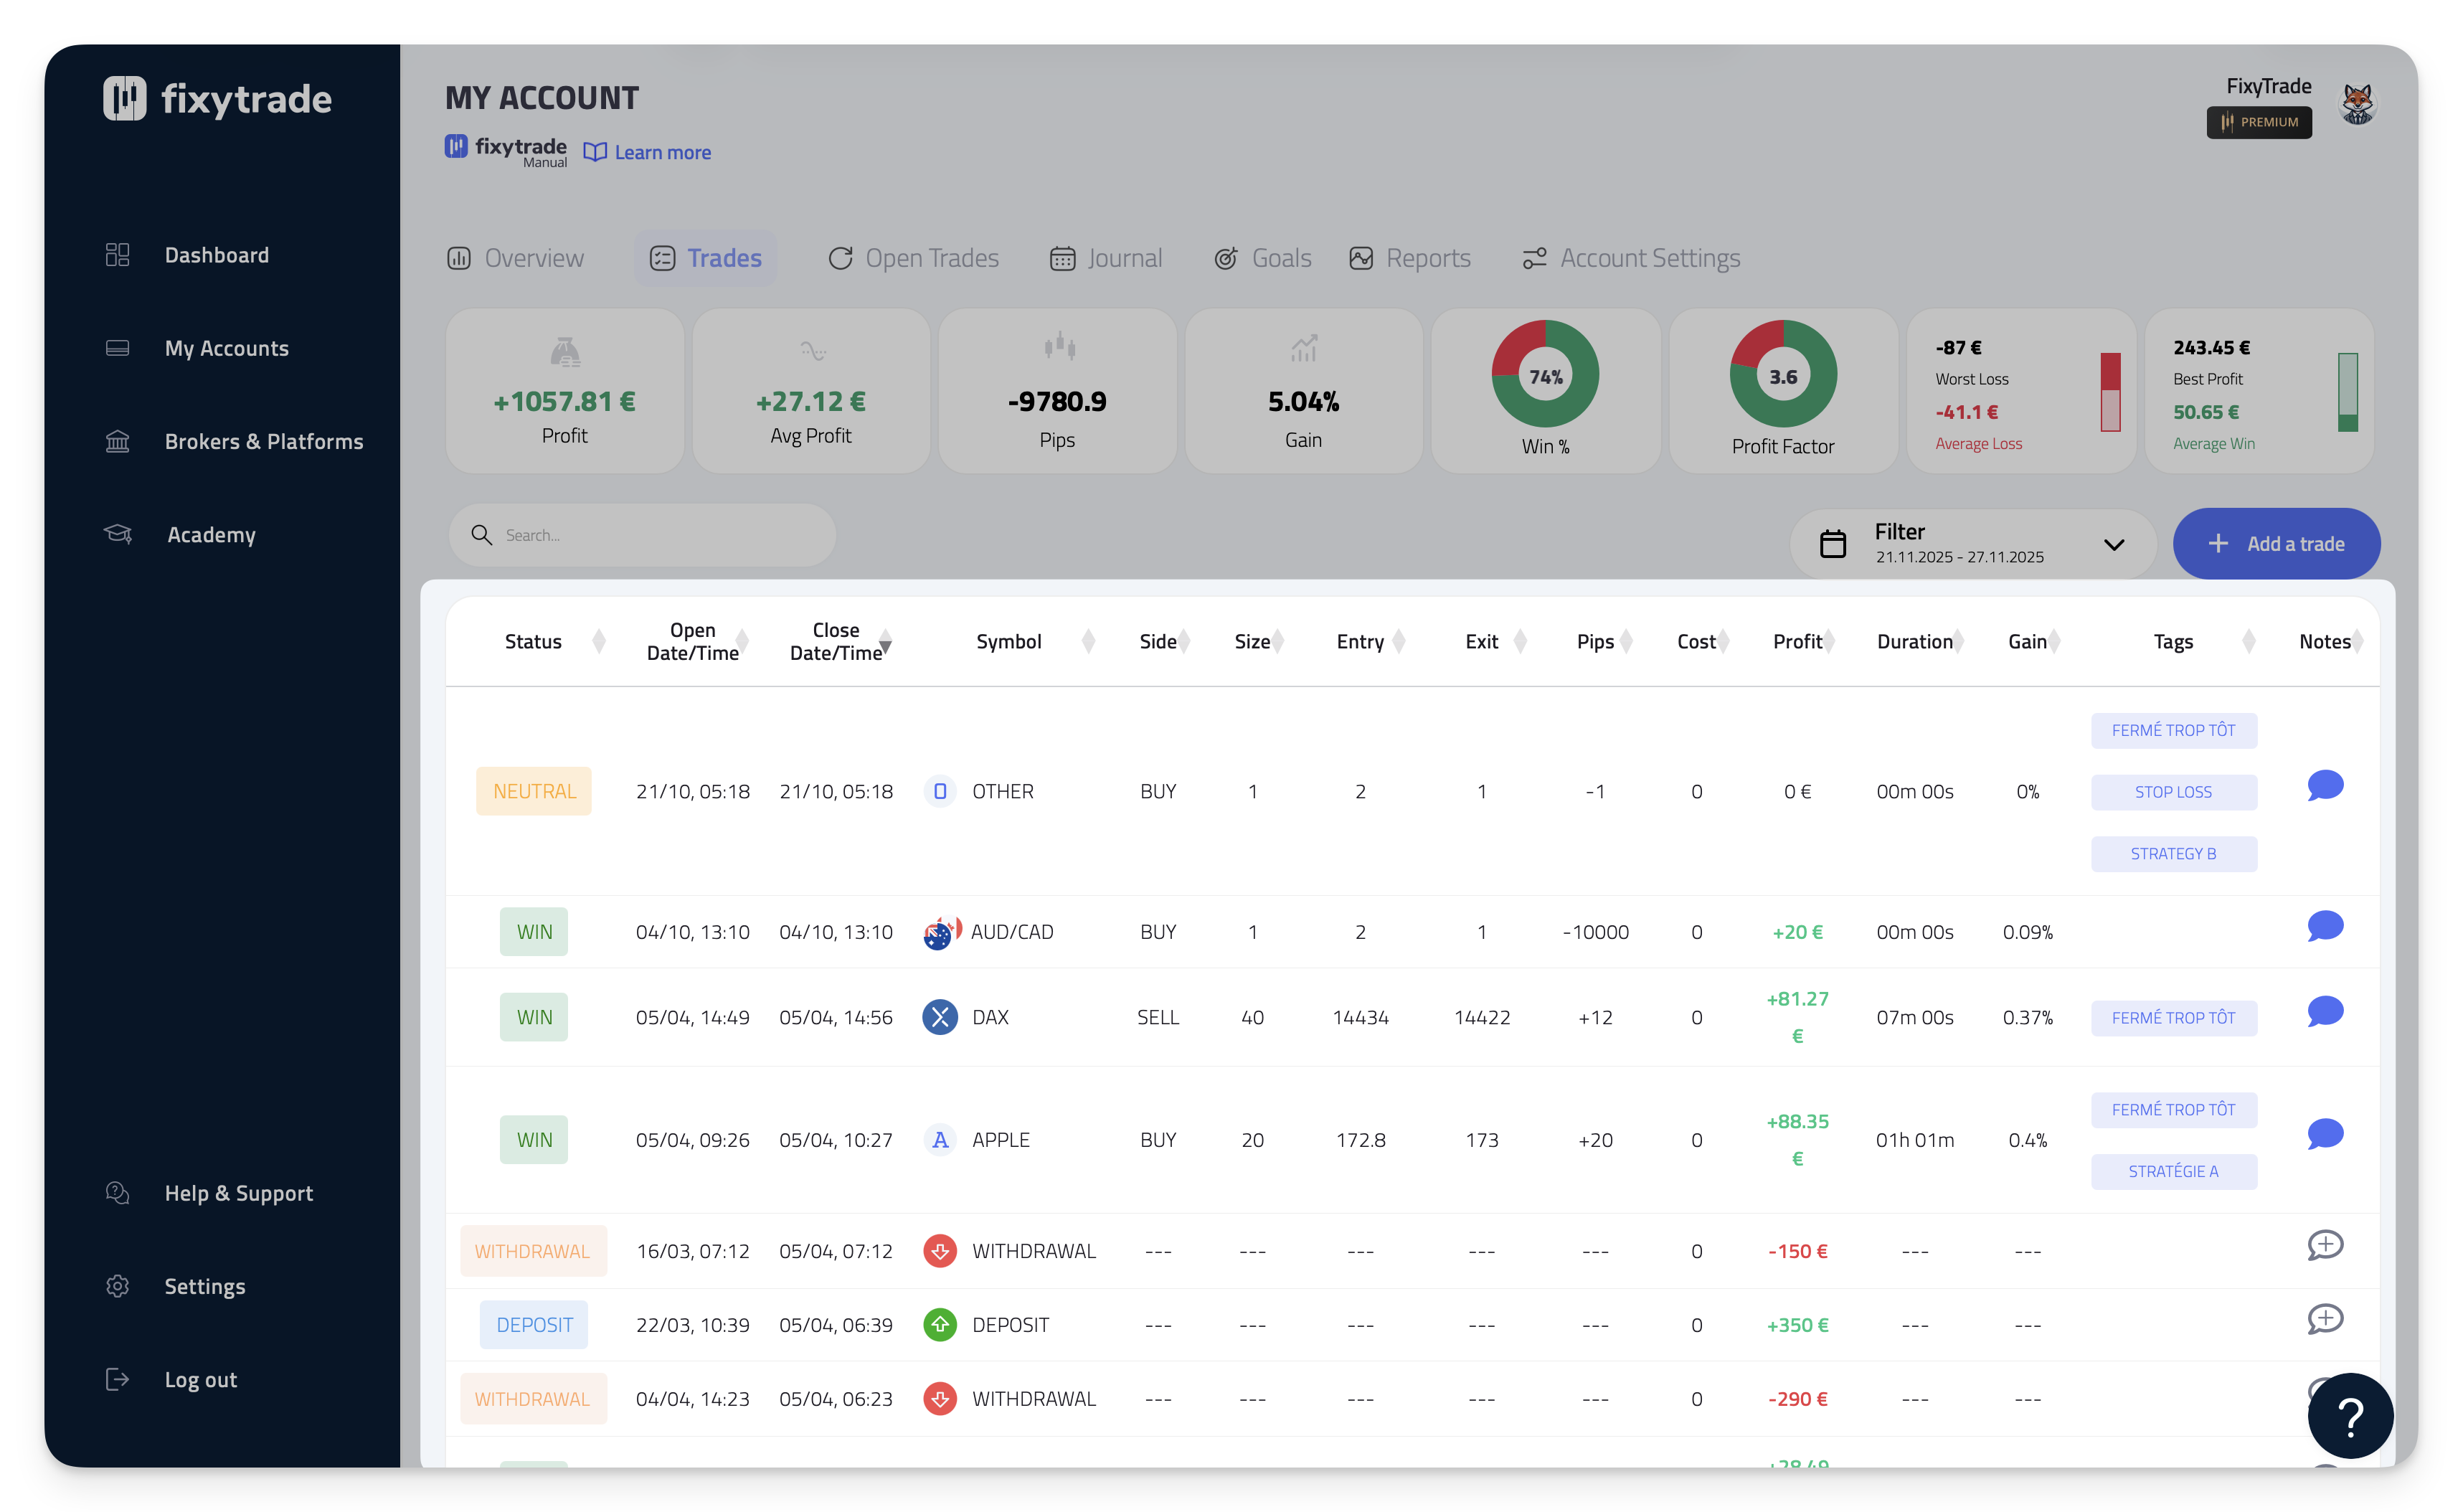
In this table only the closed trades appear. You can find 15 different columns:
-
Status: The status can be displayed in 4 different ways:
-
WIN: The trade made a profit >0
-
LOSS: The trade made a loss <=0
-
DEPOSIT: The amount added to the trading account
-
WITHDRAWAL: The amount withdrawn from the trading account
-
-
Open Date/Time: This is the time your trade was opened. That is, when you entered the position on the asset. It is also the date and time that a deposit or withdrawal was made. The display format is: DD/MM, MM:HH (Ex: 10/11, 09:24 => The trade was opened on November 10th at 09:24 AM). Learn more
-
Close Date/Time: This is when your trade was closed. That is, when you closed your position on the asset. The display format is: DD/MM, MM:HH (Ex: 12/09, 14:54 => The trade was closed on September 12th at 14:54). Learn more
-
Symbol: This is the asset on which the trade was made (Ex: EUR/USD)
-
Side: This is the direction of the trade. Did you open your trade to BUY or SELL. If it says BUY, you were looking to see the price of your asset go up to make a profit. If it says SELL, it is the opposite.
-
Size: This is the size of your position.
-
Entry: This is the price level at the opening date/time of your trade.
-
Exit: This is the price level at the Date/Time you closed your trade.
-
Pips: This is the difference between your exit level and your entry level. This column is important especially for a day trader, because it allows to understand the dynamics of the trade. Indeed, a trader who will be able to regularly cash in a positive average number of pips will see his trading profits increase naturally and without stress. It is therefore important to focus primarily on achieving goals in Pips and not in Profit. This will allow you to achieve the same results whether you have a small amount of money at the beginning and a large one in the future. Learn more
-
Fees: This column is displayed by some brokers as well as on manual and CSV accounts. It shows how much your broker charges for the trade. This is a good way to see if your broker is being too greedy. By analyzing this column, you could save a lot of money. That's more money in your pocket.
-
Profit: One of the columns that should interest you the most. It shows you the money you've made or lost per trade.
-
Notes: By clicking on the "+" icon, it will allow you to access the trade details and add comments and notes on this particular trade. You will also be able to add images (Ex: A screenshot of your trade). Adding notes is a great way to create a history of your trades and how you traded at that time (Benefits: Improved emotional management, Optimized results...) Learn more.
-
Duration: This is the time during which your trade was opened (s = seconds, m = minutes, h = hours). For example, if it is displayed 04m 52s, it means that your trade lasted 4 minutes and 52 seconds. This data is important to know if your fastest trades are necessarily the most profitable. We invite you to consult the "Duration" report to help you. Learn more
-
Gain: This is the increase or decrease of your account in percentage. For example, if it shows +1.3% on a trade, it means that your account has increased by +1.3% thanks to this trade. If your capital was $10,000 before the trade, it will be $1,030 after the trade. Learn more
-
Tags: Tags allow you to compare your trades or strategies. It's a great way to increase your trading performance to reduce your losses and increase your profits. Learn more
Also, if you click on a particular trade, you will be taken to the trade details. You will be able to add notes, images, tags, and much more. Learn more
4 - Your accumulated profits
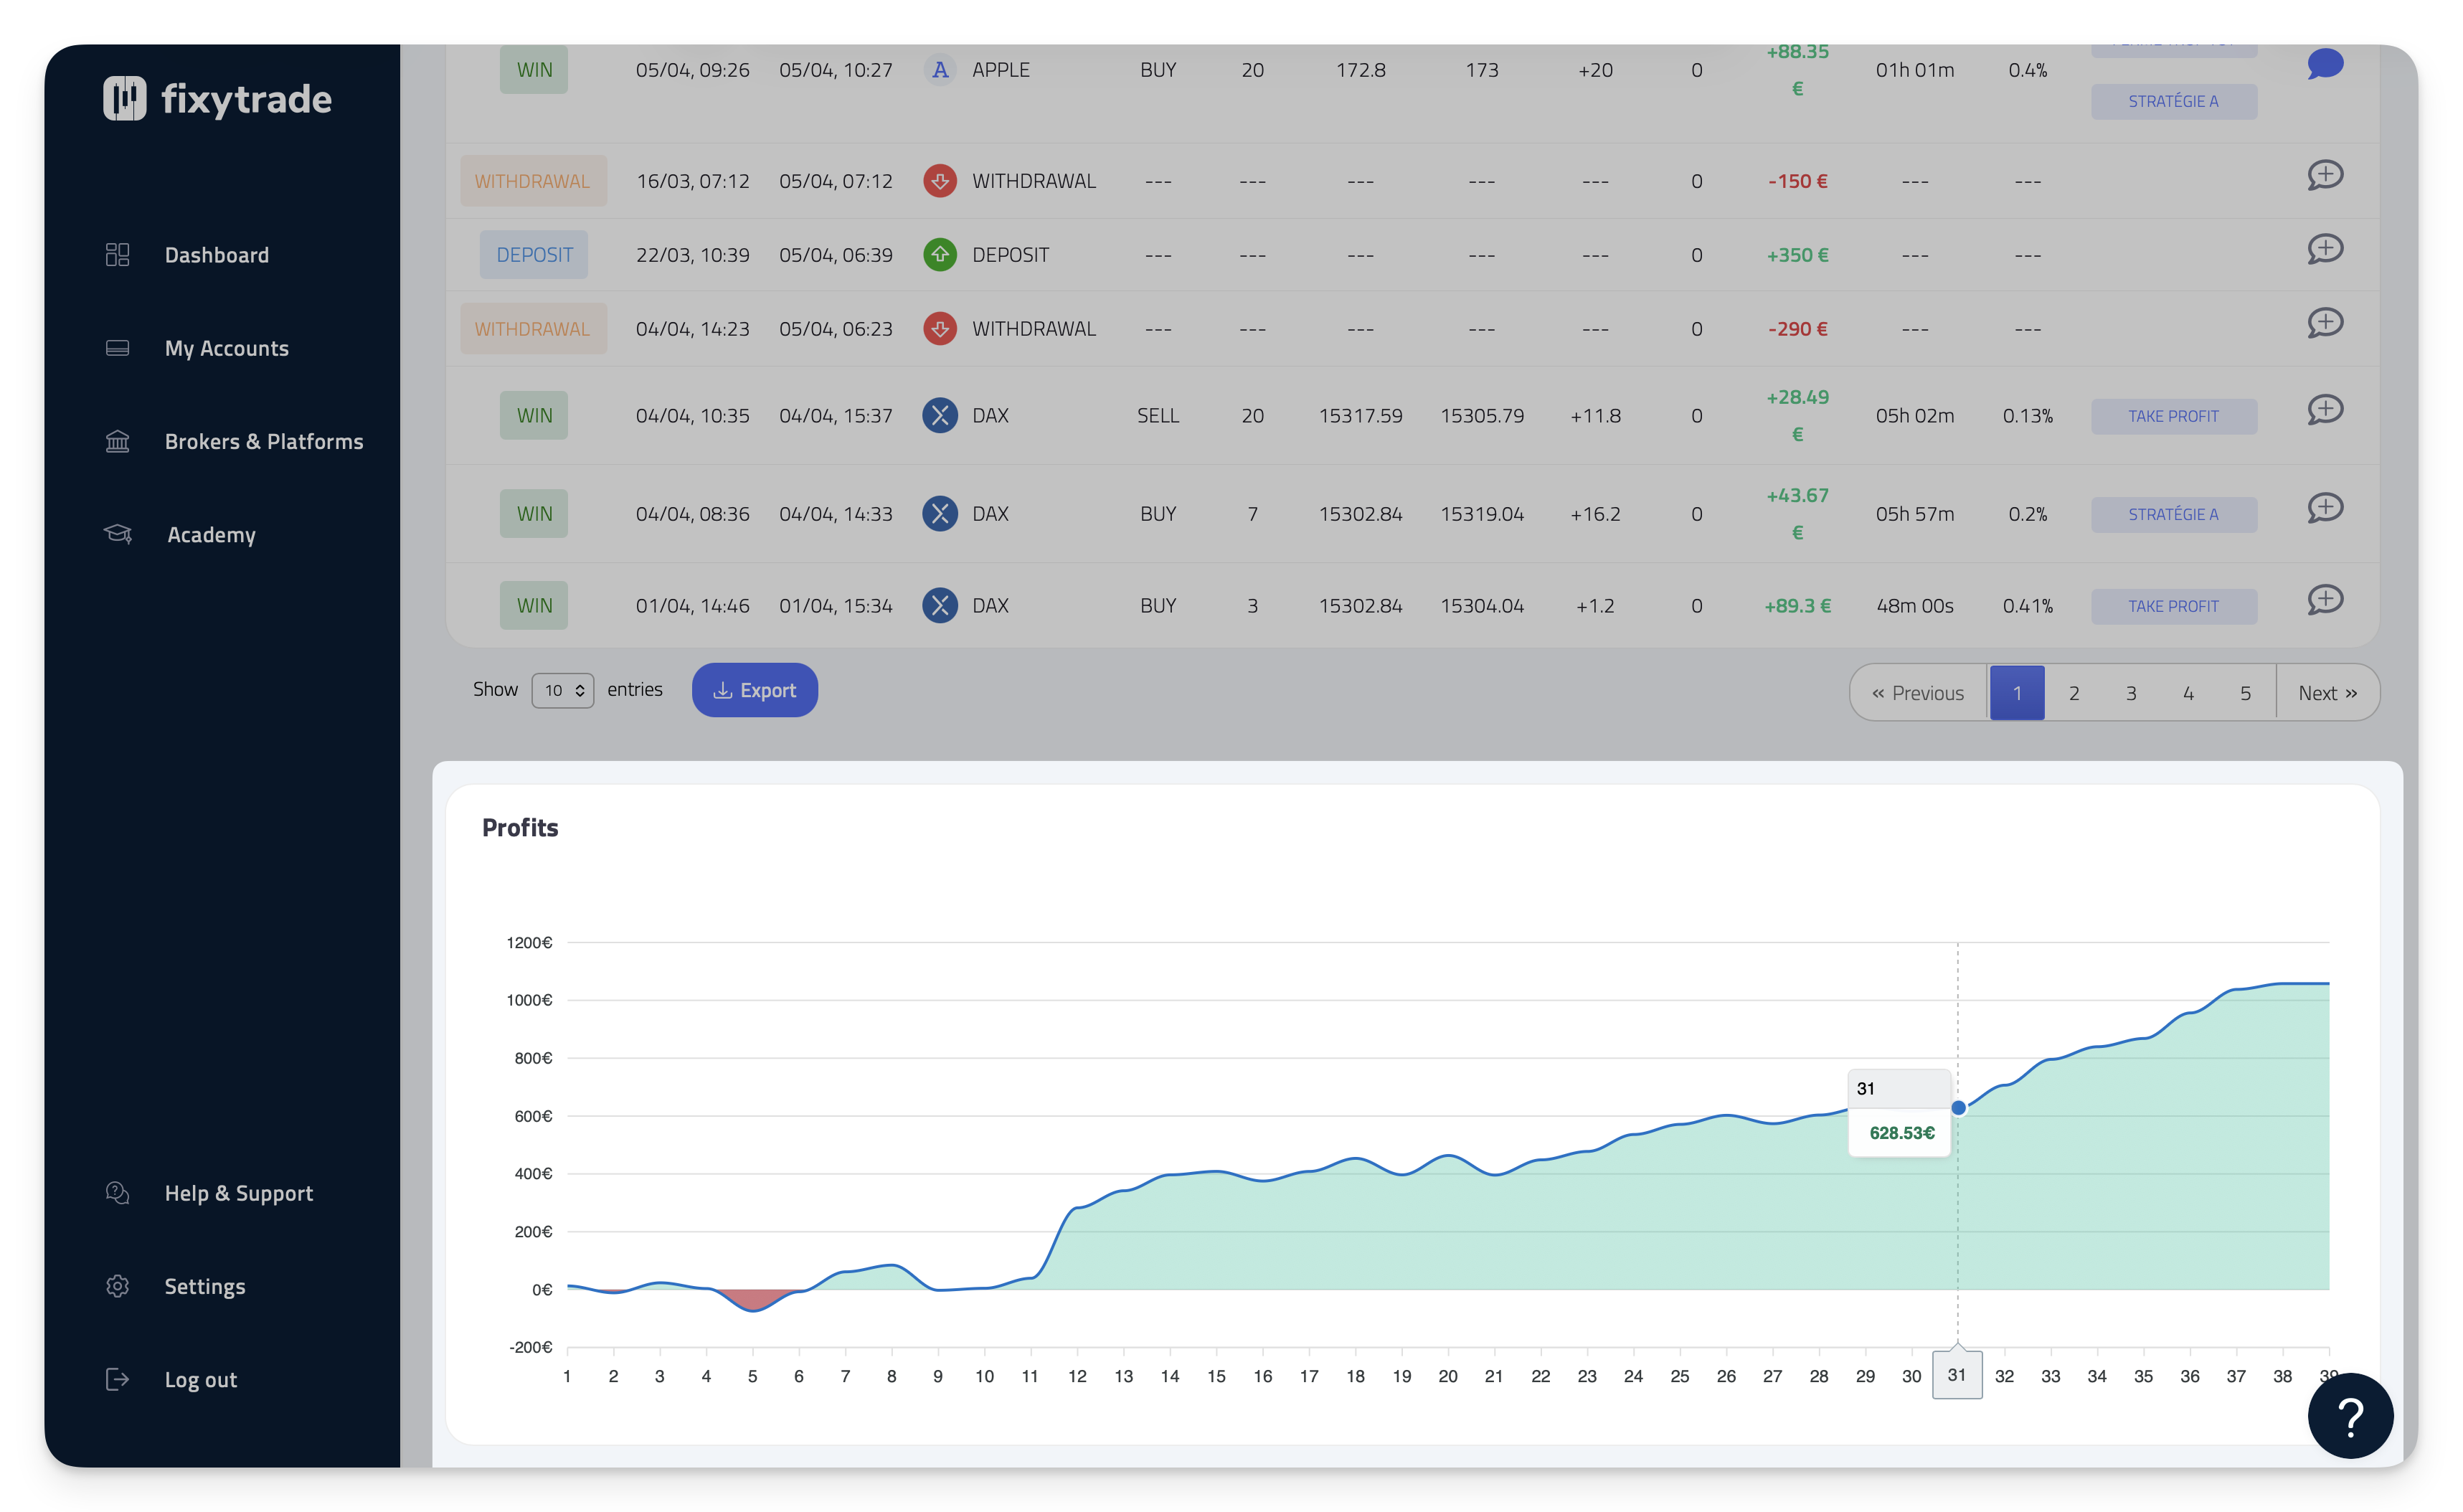
The cumulative profit chart is an important chart for the profitable trader but especially for the trader who is looking to improve his performance. Indeed, this graph is an excellent way to see if the profits of your strategy compensate for the losses made in the past.
This chart contains two axes:
-
The number of trades (x-axis)
-
The profit or loss (y-axis)